Captiva Island Weather by Month
Captiva Island, Florida, has a warm subtropical climate with mild winters, hot summers, and a rainy season that typically runs from June through September. Winter and spring are generally drier, making them popular times for beach walks, boating, fishing, and exploring the island. Summer brings higher temperatures, warm Gulf waters, and frequent afternoon showers.
Captiva Island Weather by Month
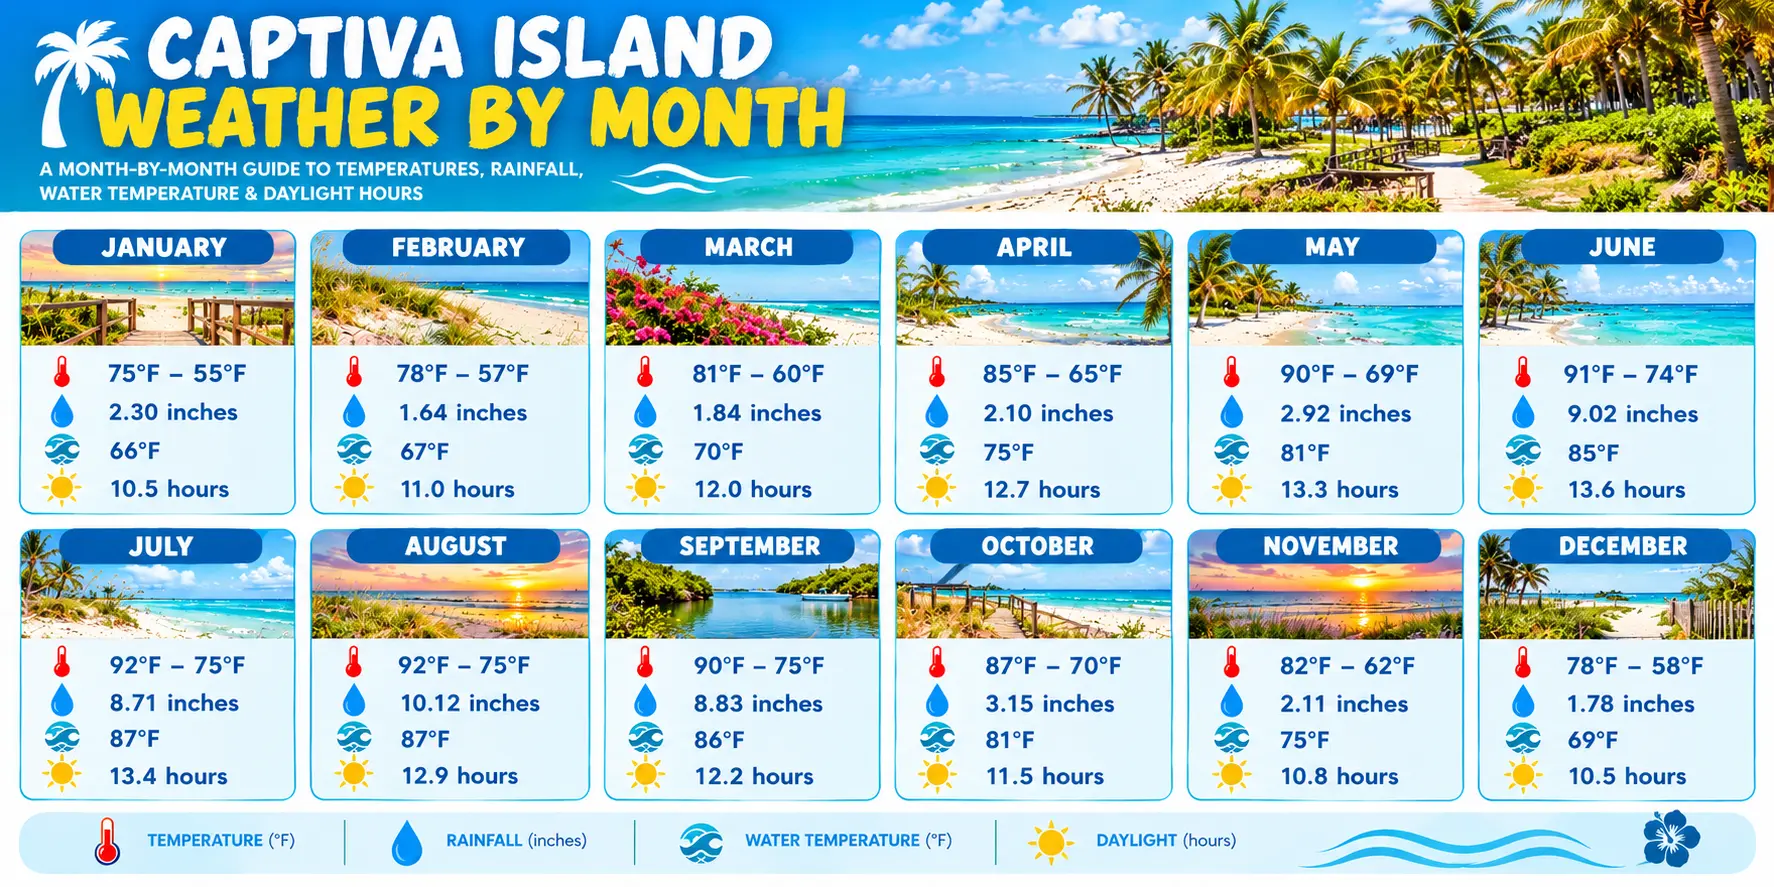
You can click the image below to view the full-size weather chart for Captiva Island.
January – Mild, Cool and Relatively Dry
- Average high: 75°F (24°C)
- Average low: 55°F (13°C)
- Rainfall: 2.30 inches (58.4 mm)
- Water temperature: 66°F (19°C)
- Daylight: 10.5 hours
January is one of the coolest months on Captiva Island, but winter weather remains mild compared with much of the United States. Average daytime temperatures reach around 75°F (24°C), while nighttime temperatures fall to approximately 55°F (13°C). The comfortable afternoons are ideal for walking along the beach, exploring the island, and enjoying outdoor dining.
Rainfall averages about 2.30 inches (58.4 mm), making January relatively dry. Gulf water temperatures hover around 66°F (19°C), which may feel chilly for extended swimming. Visitors can enjoy shell collecting, fishing, kayaking, and sunset walks, although a light jacket is useful during cooler mornings and evenings.
Best for:
- Enjoying peaceful beach walks
- Exploring the island in mild winter weather
- Fishing, boating, and wildlife watching
- Escaping colder winter climates
February – Warm, Pleasant and Mostly Dry
- Average high: 78°F (26°C)
- Average low: 57°F (14°C)
- Rainfall: 1.64 inches (41.7 mm)
- Water temperature: 67°F (19°C)
- Daylight: 11 hours
February brings slightly warmer temperatures and some of the driest conditions of the year to Captiva Island. Average highs reach 78°F (26°C), while nighttime lows remain around 57°F (14°C). Sunny afternoons are excellent for relaxing on the beach, taking boat trips, and exploring the island’s natural scenery.
With only about 1.64 inches (41.7 mm) of rainfall, February is an excellent month for outdoor activities. Gulf water temperatures average around 67°F (19°C), which can still feel cool for swimming. The island’s pleasant weather and relatively low rainfall make it a popular choice for a winter getaway.
Best for:
- Enjoying sunny beach days
- Taking boat tours and fishing trips
- Exploring wildlife and coastal scenery
- Planning outdoor activities with less rain
March – Warm, Sunny and Comfortable
- Average high: 81°F (27°C)
- Average low: 60°F (16°C)
- Rainfall: 1.84 inches (46.7 mm)
- Water temperature: 70°F (21°C)
- Daylight: 12 hours
March marks the beginning of warmer spring weather on Captiva Island. Average daytime temperatures reach 81°F (27°C), while nighttime temperatures settle around 60°F (16°C). The warm afternoons and relatively comfortable evenings create excellent conditions for beach activities, cycling, and sightseeing.
Rainfall remains low at approximately 1.84 inches (46.7 mm), so visitors can generally expect plenty of opportunities to enjoy the outdoors. Gulf water temperatures rise to around 70°F (21°C), making swimming more appealing, although the water may still feel cool to some visitors. Longer days also provide more time for boating, fishing, and watching sunsets over the Gulf.
Best for:
- Enjoying spring sunshine
- Exploring beaches and coastal trails
- Kayaking, fishing, and boating
- Taking advantage of longer daylight hours
April – Warm, Sunny and Ideal for the Beach
- Average high: 85°F (29°C)
- Average low: 65°F (18°C)
- Rainfall: 2.10 inches (53.3 mm)
- Water temperature: 75°F (24°C)
- Daylight: 12.7 hours
April is one of the most enjoyable months to visit Captiva Island, with warm days, comfortable evenings, and plenty of sunshine. Average highs reach 85°F (29°C), while nighttime lows average 65°F (18°C). The weather is excellent for swimming, sunbathing, shelling, and exploring the island’s waterfront restaurants and shops.
Rainfall averages around 2.10 inches (53.3 mm), so prolonged wet weather is generally less common than during summer. Gulf water temperatures reach approximately 75°F (24°C), providing pleasant conditions for swimming and other water activities. With nearly 13 hours of daylight, visitors have plenty of time to enjoy the beach and explore the surrounding islands.
Best for:
- Swimming and sunbathing
- Enjoying warm Gulf waters
- Taking boat trips and wildlife tours
- Exploring Captiva before the summer rainy season
May – Hot, Sunny and Increasingly Humid
- Average high: 90°F (32°C)
- Average low: 69°F (21°C)
- Rainfall: 2.92 inches (74.2 mm)
- Water temperature: 81°F (27°C)
- Daylight: 13.3 hours
May brings the beginning of summer-like conditions to Captiva Island. Average daytime temperatures climb to 90°F (32°C), and nighttime lows reach approximately 69°F (21°C). The warmer weather is perfect for swimming, paddleboarding, boating, and relaxing on the beach, although afternoons can feel increasingly hot.
Rainfall rises to around 2.92 inches (74.2 mm) as the wetter season approaches. Gulf water temperatures average about 81°F (27°C), making swimming especially inviting. Longer daylight hours provide plenty of time for outdoor adventures, but visitors should bring sunscreen, drink plenty of water, and plan strenuous activities for the cooler morning hours.
Best for:
- Swimming in warm Gulf waters
- Paddleboarding and kayaking
- Enjoying long beach days
- Taking early-morning boat trips
June – Hot, Humid and Rainy
- Average high: 91°F (33°C)
- Average low: 74°F (23°C)
- Rainfall: 9.02 inches (229.1 mm)
- Water temperature: 85°F (29°C)
- Daylight: 13.6 hours
June marks the start of the rainy season on Captiva Island. Average highs reach 91°F (33°C), while nighttime temperatures remain around 74°F (23°C). The weather is hot and humid, and afternoon thunderstorms become more frequent. Mornings are often the best time for beach visits, kayaking, and boat excursions.
Rainfall increases sharply to approximately 9.02 inches (229.1 mm), so visitors should expect occasional heavy showers and possible thunderstorms. Gulf water temperatures average around 85°F (29°C), providing excellent conditions for swimming. Despite the rain, June offers long daylight hours and plenty of opportunities for water activities between showers.
Best for:
- Swimming and water sports
- Enjoying warm ocean temperatures
- Taking advantage of long summer days
- Planning flexible activities around afternoon showers
July – Very Hot, Humid and Wet
- Average high: 92°F (33°C)
- Average low: 75°F (24°C)
- Rainfall: 8.71 inches (221.2 mm)
- Water temperature: 87°F (31°C)
- Daylight: 13.4 hours
July is one of the hottest months on Captiva Island, with average daytime temperatures reaching 92°F (33°C) and nighttime lows around 75°F (24°C). High humidity can make the weather feel even hotter, particularly during the afternoon. Beach activities remain popular, but early mornings and late afternoons are generally more comfortable for outdoor exploration.
Rainfall averages approximately 8.71 inches (221.2 mm), with frequent showers and thunderstorms, often developing later in the day. Gulf water temperatures reach around 87°F (31°C), making the water feel very warm. July is also within the Atlantic hurricane season, so visitors should monitor forecasts and local weather advisories when planning boating trips.
Best for:
- Swimming in very warm Gulf waters
- Enjoying beach activities between showers
- Taking early-morning kayak trips
- Relaxing with flexible indoor and outdoor plans
August – Hot, Tropical and Very Rainy
- Average high: 92°F (33°C)
- Average low: 75°F (24°C)
- Rainfall: 10.12 inches (257.0 mm)
- Water temperature: 87°F (31°C)
- Daylight: 12.9 hours
August is typically one of the wettest months on Captiva Island. Average highs remain around 92°F (33°C), while nighttime temperatures average 75°F (24°C). The combination of heat and humidity creates a tropical atmosphere, and visitors should be prepared for sudden downpours and thunderstorms.
Rainfall reaches approximately 10.12 inches (257.0 mm), the highest monthly total in the supplied data. Gulf water temperatures remain near 87°F (31°C), making swimming and water sports appealing when conditions are safe. August also falls during the peak of the Atlantic hurricane season, so checking weather forecasts before and during a trip is particularly important.
Best for:
- Swimming in warm Gulf waters
- Enjoying tropical island scenery
- Scheduling beach activities around showers
- Taking advantage of quieter periods between busy travel dates
September – Hot, Humid and Stormy
- Average high: 90°F (32°C)
- Average low: 75°F (24°C)
- Rainfall: 8.83 inches (224.3 mm)
- Water temperature: 86°F (30°C)
- Daylight: 12.2 hours
September remains hot and humid on Captiva Island, although average daytime temperatures ease slightly to 90°F (32°C). Nighttime lows stay around 75°F (24°C), keeping evenings warm. The island’s beaches and warm Gulf waters remain attractive, but visitors should expect tropical showers and changing weather conditions.
Rainfall averages about 8.83 inches (224.3 mm), making September one of the wettest months of the year. Gulf water temperatures hover around 86°F (30°C), which is excellent for swimming when conditions are safe. September is also within the peak of hurricane season, so travelers should pay close attention to forecasts and consider flexible travel arrangements.
Best for:
- Swimming in warm Gulf waters
- Enjoying the island’s tropical atmosphere
- Taking advantage of quieter beach periods
- Planning flexible activities around weather conditions
October – Warm, Pleasant and Less Rainy
- Average high: 87°F (31°C)
- Average low: 70°F (21°C)
- Rainfall: 3.15 inches (80.0 mm)
- Water temperature: 81°F (27°C)
- Daylight: 11.5 hours
October brings a welcome transition toward drier and more comfortable weather on Captiva Island. Average highs reach 87°F (31°C), while nighttime temperatures fall to around 70°F (21°C). The weather remains warm enough for swimming and sunbathing, but outdoor exploration becomes more comfortable as summer heat gradually subsides.
Rainfall drops to approximately 3.15 inches (80.0 mm), considerably lower than the summer peak. Gulf water temperatures average around 81°F (27°C), remaining warm enough for enjoyable swimming. Although hurricane season continues, October often offers a good balance of warm weather, beach conditions, and opportunities for boating and sightseeing.
Best for:
- Enjoying warm beaches with less summer humidity
- Swimming and kayaking
- Exploring the island’s shops and restaurants
- Taking boat trips and sunset cruises
November – Warm Days, Cool Evenings and Drier Weather
- Average high: 82°F (28°C)
- Average low: 62°F (17°C)
- Rainfall: 2.11 inches (53.6 mm)
- Water temperature: 75°F (24°C)
- Daylight: 10.8 hours
November brings comfortable autumn weather to Captiva Island. Average daytime temperatures reach 82°F (28°C), while nighttime lows fall to around 62°F (17°C). Humidity generally becomes more manageable, and the milder conditions are ideal for beach walks, fishing, cycling, and exploring the island.
Rainfall averages approximately 2.11 inches (53.6 mm), making November relatively dry compared with summer. Gulf water temperatures decline to around 75°F (24°C), which remains comfortable for many swimmers. With pleasant daytime temperatures and fewer heavy showers, November is a great month for enjoying outdoor activities without the intensity of summer heat.
Best for:
- Walking along quieter beaches
- Fishing and boating
- Exploring the island in comfortable weather
- Enjoying outdoor dining and sunset views
December – Mild, Sunny and Relatively Dry
- Average high: 78°F (26°C)
- Average low: 58°F (14°C)
- Rainfall: 1.78 inches (45.2 mm)
- Water temperature: 69°F (21°C)
- Daylight: 10.5 hours
December brings mild winter weather to Captiva Island, making it an appealing destination for travelers escaping colder climates. Average daytime highs reach 78°F (26°C), while nighttime temperatures average 58°F (14°C). Sunny afternoons are ideal for beach walks, shell collecting, fishing, and enjoying the island’s relaxed coastal atmosphere.
Rainfall averages about 1.78 inches (45.2 mm), keeping December among the drier months. Gulf water temperatures fall to around 69°F (21°C), which may feel cool for some swimmers but remains suitable for various water activities. Evenings can be cool, so bringing a light jacket is a good idea, especially for sunset cruises and outdoor dining.
Best for:
- Escaping cold winter weather
- Enjoying peaceful beach walks
- Fishing, boating, and sightseeing
- Celebrating the holidays in a tropical setting
Captiva Island Weather by Month: Summary Table
| Month | Avg High °F (°C) | Avg Low °F (°C) | Rainfall (inches) | Water Temperature (°F) | Daylight (hours) |
|---|---|---|---|---|---|
| January | 75 (24) | 55 (13) | 2.30 | 66 | 10.5 |
| February | 78 (26) | 57 (14) | 1.64 | 67 | 11.0 |
| March | 81 (27) | 60 (16) | 1.84 | 70 | 12.0 |
| April | 85 (29) | 65 (18) | 2.10 | 75 | 12.7 |
| May | 90 (32) | 69 (21) | 2.92 | 81 | 13.3 |
| June | 91 (33) | 74 (23) | 9.02 | 85 | 13.6 |
| July | 92 (33) | 75 (24) | 8.71 | 87 | 13.4 |
| August | 92 (33) | 75 (24) | 10.12 | 87 | 12.9 |
| September | 90 (32) | 75 (24) | 8.83 | 86 | 12.2 |
| October | 87 (31) | 70 (21) | 3.15 | 81 | 11.5 |
| November | 82 (28) | 62 (17) | 2.11 | 75 | 10.8 |
| December | 78 (26) | 58 (14) | 1.78 | 69 | 10.5 |
When Is the Best Time to Visit Captiva Island?
The best time to visit Captiva Island is generally March through May or October through November, when warm temperatures combine with relatively lower rainfall.
- Best weather: March and April offer warm days, comfortable evenings, and comparatively little rain.
- Best for swimming: May through October, when Gulf water temperatures are generally warm.
- Best for a winter getaway: December through February, when temperatures are mild and rainfall is relatively low.
- Best for avoiding heavy rain: February and March are among the driest months in the supplied data.
- Months to watch for storms: June through September bring heavier rainfall, and the Atlantic hurricane season runs from June 1 through November 30.
Overall, Captiva Island is a year-round destination, but spring is particularly appealing for visitors who want warm beach weather without the heaviest summer rainfall.
20 FAQs About Captiva Island Weather
1. What is the best month to visit Captiva Island?
March and April are among the best months to visit Captiva Island because they offer warm temperatures, relatively low rainfall, and comfortable conditions for beach activities and sightseeing.
2. What is the weather like on Captiva Island year-round?
Captiva Island has a warm subtropical climate with mild winters, hot and humid summers, and a rainy season that typically lasts from June through September.
3. What is the coldest month on Captiva Island?
January is generally one of the coolest months, with an average high of 75°F (24°C) and an average low of 55°F (13°C).
4. What is the hottest month on Captiva Island?
July and August are typically the hottest months, with average highs of 92°F (33°C) and nighttime lows around 75°F (24°C).
5. Does Captiva Island get cold in winter?
Captiva Island has mild winters compared with much of the United States. Daytime temperatures often range from the mid-70s to upper 70s°F (24–26°C), although mornings and evenings can feel cool.
6. How much rain does Captiva Island get?
Rainfall varies considerably throughout the year. February is one of the driest months in the supplied data, with 1.64 inches (41.7 mm), while August is the wettest, with 10.12 inches (257.0 mm).
7. What is the rainiest month on Captiva Island?
August is the rainiest month in the supplied data, averaging 10.12 inches (257.0 mm) of rainfall. Frequent showers and thunderstorms are common during summer.
8. What is the driest month on Captiva Island?
February is the driest month in the supplied data, with approximately 1.64 inches (41.7 mm) of rainfall. March is also relatively dry, averaging 1.84 inches (46.7 mm).
9. When is the rainy season on Captiva Island?
The rainy season generally runs from June through September. These months bring higher humidity, frequent afternoon thunderstorms, and substantially more rainfall than winter and spring.
10. When is the dry season on Captiva Island?
The drier season typically extends from late fall through spring, particularly from November through April. February and March are especially good choices for visitors seeking lower rainfall.
11. What is the average water temperature on Captiva Island?
Gulf water temperatures range from approximately 66°F (19°C) in January to 87°F (31°C) in July and August. Water temperatures are generally warmest during summer and early fall.
12. Can you swim on Captiva Island in January?
Yes, swimming is possible in January, but the Gulf water averages around 66°F (19°C), which may feel cold for some visitors. Beach walks, shell collecting, and fishing are comfortable alternatives on cooler days.
13. When is the best time to swim on Captiva Island?
May through October is generally best for swimming because Gulf water temperatures are warm, typically around 81–87°F (27–31°C). Always check local beach conditions before entering the water.
14. Is Captiva Island humid?
Yes. Captiva Island is humid throughout the year, with humidity generally feeling highest during summer. The combination of high temperatures and moisture can make July, August, and September feel particularly muggy.
15. Does Captiva Island experience hurricanes?
Yes. Captiva Island is exposed to tropical storms and hurricanes during the Atlantic hurricane season, which runs from June 1 through November 30. Visitors should monitor official forecasts and follow local evacuation guidance when necessary.
16. What is the best time to visit Captiva Island for beach activities?
March through May and October are excellent choices for beach activities. These periods generally offer warm weather, inviting Gulf waters, and less rainfall than the peak summer months.
17. Is Captiva Island warm in December?
Yes. December has an average high of 78°F (26°C) and an average low of 58°F (14°C). The weather is usually pleasant for beach walks, boating, and outdoor dining, although evenings can be cool.
18. How many hours of daylight does Captiva Island get?
Daylight ranges from approximately 10.5 hours per day in winter to about 13.6 hours in June. Longer summer days provide more time for swimming, boating, and exploring the island.
19. Is summer a good time to visit Captiva Island?
Summer can be a good time to visit if you enjoy hot weather and warm Gulf waters. However, June through September brings heavy rainfall, high humidity, thunderstorms, and an increased risk of tropical storms. Flexible outdoor plans are recommended.
20. What should I pack for Captiva Island?
Pack lightweight clothing, swimwear, sunscreen, sunglasses, a hat, sandals, and comfortable walking shoes. During summer, bring a light rain jacket and consider insect repellent. In winter, a light sweater or jacket is useful for cooler mornings and evenings.